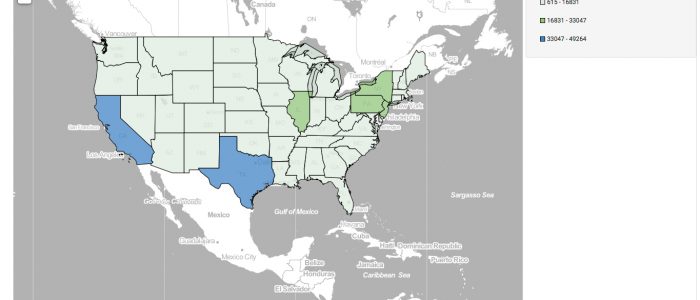
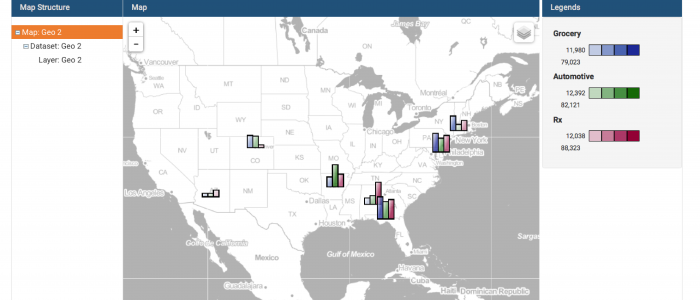
Today marks the 30th anniversary of Argentina’s victory over England in World Cup play, a victory assisted in part by Argentinian superstar Diego Madonna’s celebrated “Hand of God” goal. These two maps show the number of US high schools with soccer programs by state and the number of participants in those programs during the 2014-2015 completion season. […]
Map of the Day: Active KKK Chapters in Mississippi
On June 21, 1964, three civil rights field workers went missing in Neshoba County in central Mississippi. It was later determined that Michael Schwerner, Andrew Goodman and James Chaney had been killed by members of the Ku Klux Klan. The disappearance and murder of the three Congress of Racial Equality (CORE) workers drew national attention […]
Map of the Day: Washington county map displaying median household income and percentage of population 18+ who are Veterans
This map displays two county-level metrics for the state of Washington: median household income (blue shades) and the percentage of the population 18+ who are Veterans (red shade dots). We chose to use FactLook’s geocoding feature (Location: Street Address) to place markers at each county’s courthouse address and tied the population percentage data to these markers. The […]
Step-by-step: Building a simple county map with a single metric – Part2
In a previous tutorial, we showed how to build a county-based map with a single metric in FactLook. In this tutorial, we’ll adjust some of the styles to create a more visually compelling thematic map. Specifically, we’ll adjust: Changing the number of breaks Using the color palette to assign unique colors to each break Displaying decimal […]
Step-by-step: Building a simple county map with a single metric – Part 1
In this step-by-step tutorial, we’ll show you how to create a basic area-based map using a single metric. For this example, we’ll be building a map that has data for all counties in the state of Kentucky. The steps presented would be the same for any of the other area-map choices FactLook offers. Above is the finished […]
Step-by-step: building a multi-metric map with geocoded locations
FactLook gives you the capability to assign multiple metric values to a single geocoded location which are then displayed on a map as fully-customizable bar charts. 1. Format your spreadsheet: Format your spreadsheet in the same manner as when using FactLook’s geocoding feature. In addition to the required columns of data, you’ll want […]
Video: Basic Geocoding
This video tutorial shows how to use FactLook’s geocoding features.
Census tract map with geocoded bar charts
We wanted to display how well certain product categories were performing at a fictitios multi-store grocery chain. First we created a census-tract layer displaying owner-occupied home data (maker shades of blue indicate heavier ownership). We then used FactLook’s geocoding feature to pin every store’s location on the map, then used bar charts to show sales […]
State map showing regions with geocoding
This map displays data about a fictitious grocery outlet. The first layer organizes the US states into different regions (West, South, etc.). The geocoded layers display each stores revenue: three breaks, ranging from red (low) to yellow (medium) to green (high). The hexagon markers represent specialty food stores participating in a pilot program to test validity.
County map using bar chart to display income, sales and population demos
Arkansas map, showing median household income by county (green shading). Then the multiple-metric bar chart markers are showing grocery category sales for each store of a fictional retail chain along with population 65 years and older. The bar charts display a single metric (overall grocery sales) vs multiple-metric for individual category sales. The height of […]