The leaves are turning and the kegs are tapped — it can only mean one thing. Oktoberfest season has arrived! We were curious where some of the best “Fests” would be which led us to wonder which communities have some of the largest German populations. We landed on St. Louis. Pulling data from the US Census Bureau’s American […]
MOTD: 092316 — US Auto Accident Fatalities 2015
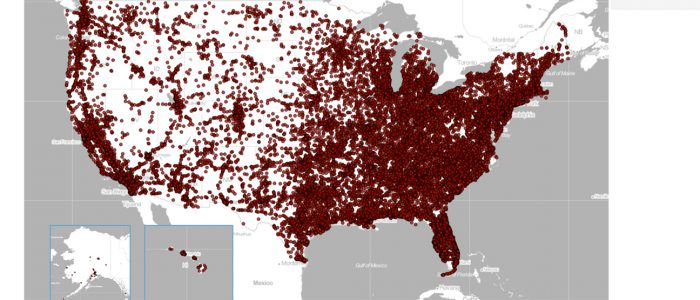
The US Department of Transportation’s National HighwayTraffic Safety Administration maintains a nationwide census of fatal injuries suffered in motor vehicle traffic crashes. The Fatality Analysis Reporting System (FARS) can be accessed here. Using the FARS data and FactLook’s geocoding feature, we plotted every auto accident by the number of fatalities. The first data viz we created is for […]
MOTD: 092116 Percentage of KY Population Physically Inactive (2016)
Physical Inactivity is one of the measures health agency’s use in factoring a demographics overall wellness. The County Health Rankings & Roadmaps tracks numerous measures on a county basis, including physical inactivity. The CHRR data is for the percentage of adults aged 20 and over reporting no leisure-time physical activity. What are the health consequences of being […]
MOTD: 091916 Number of Honey Bee Colonies Lost with Five or More Colonies: January-March 2016
It’s well known that the US honey bee population is seriously stressed. The US Department of Agriculture keeps track of these important pollinators and produces a quarterly report on the health of the bee population via its National Agriculture Statistics Service. We took data from the NASS report to visualize the percentage of colonies lost for […]
MOTD: 091516 Miami-Dade County Contaminated Sites and Population
The Miami-Dade County OpenData portal has a dataset on contaminated sites — nearly 2,500 of them — across the county. We used FactLook’s latitude and longitude geocoding feature to plot those sites. We then pulled population data for Miami-Dade from the US Census Bureau. The resulting data viz is below. Want to build a data […]
MOTD: 091416 DC Crime Stats 2015 (Assault with Deadly Weapon & Homicide)
While politicians like to think theirs is the roughest game in the nation’s capital, there’s a real life and death struggle taking place on the district’s streets. We pulled data from the DC Open Data portal for Crime Incidents in 2015, and then filtered the data to display crime reports for Assaults with a Deadly Weapon and […]
MOTD: 091316 – CA Software publishers by county
We wanted to see where software publishers were concentrated in California and found the data at the US Census Bureau. We broke out the data by county, and the resulting data viz is below: Want to build a data viz like this? Try FactLook.com for 7-days FREE.
MOTD: 091216 – San Francisco Avg. Monthly Rent and Median Household Income
We were curious as to where rents are highest in notoriously high-rent San Francisco. We found that data, broken out by neighborhood, at rentjungle.com. We then used FactLook’s geocoding feature to plot that data by latitude and longitude. Finally, we created another layer displaying median household income with data obtained via the US Census Bureau. […]
MOTD: 090916 – San Francisco County Total Households and Location of BikeShare Stations
We found a dataset for BikeShare Stations in San Francisco and coupled it with US. Census Bureau data for the total number of households by census tract in San Francisco County. Here’s the result:
MOTD: 090816 – Florida Population by ZIP
On September 8, 1565 Spain founded the first permanent European colony in North America at St. Augustine, Florida. The sunshine state has grown a bit in the ensuing 451 years. This data viz displays the state’s total population by ZIP code using data obtained from the US Census Bureau. We’ve pinned a red triangle at […]