As of July 14, 2016, the Centers for Disease Control and Prevention is actively investigating eight multi-state outbreaks of human Salmonella infections linked to contact with live poultry in backyard flocks. In the eight outbreaks, a total of 611 people have been reported infected with the outbreak strains across 45 states. The following map shows […]
MOTD: 072816 Travel-Associated Cases of Zika Virus, US
With the Olympic Games set to kick off in just a few days time, we wanted to take a snapshot of current travel-associated Zika virus cases in the US to use in a comparison after travelers have returned from Brazil. Our data comes from the Centers for Disease Control and Prevention which maintains a database of […]
MOTD: 072718 Child Abductions, Chicago 2016
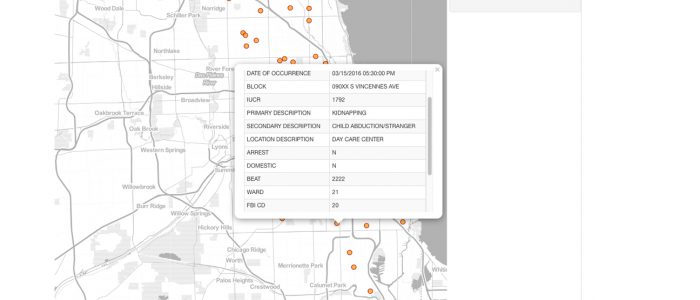
On this day in 1981, six year old Adam John Walsh was abducted from a Hollywood, Florida mall. He was later found murdered. His death led his father John Walsh to become one of the country’s leading advocates for tougher penalties for those who commit crimes against children. In 1984 he founded the National Center […]
Kentucky Obesity Rates and Location of Farmers Markets
Kentucky has one of the highest obesity rates in the country. We used stats from County Health Rankings to display the percentage of the Commonwealth’s population by county that are obese. We then added a second metric — the location of farmers’ markets across the state. It’s quickly obvious the lack of these sources of fresh […]
MOTD: CA Exceptional Drought and Location of Golf Courses
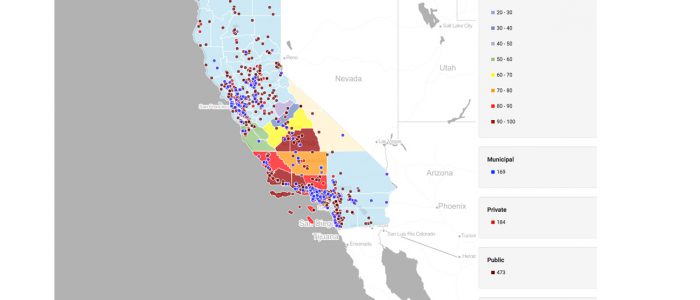
It’s tough watching loved ones suffer. If golf is your game and your favorite course is in drought-stricken California, odds are you’ve seen verdant fairways turn ochre and watched balls skid across rock hard greens. According to CBS.com, “There are 866 golf courses in California. An average 18-hole course uses 90 million gallons of water […]
072016 – Major US Dams by Year Constructed
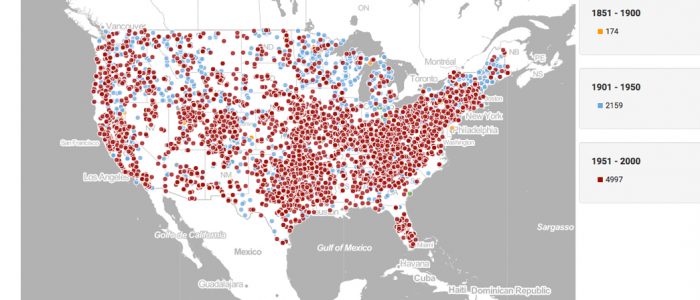
We pulled data from the US Bureau of Transportation Statistics which has compiled a spreadsheet of major dams in the United States that are 50 feet or more in height, or with a normal storage capacity of 5,000 acre-feet or more, or with a maximum storage capacity of 25,000 acre-feet or more. We then filtered the data […]
MOTD: 071916 Amtrak Stations
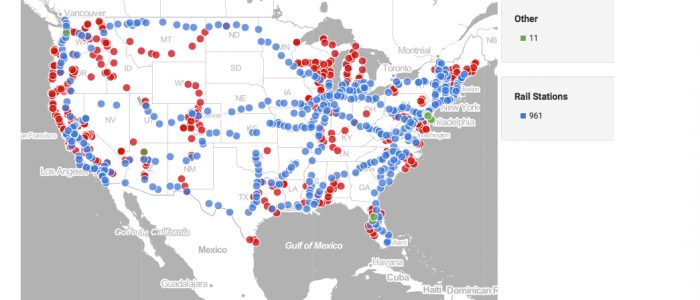
This visualization displays the location of Amtrak Stations across the United States. The Federal Railroad Administration’s (FRA) Amtrak Station database organizes this data by Bus, Rail and Other. We obtained the data from the US Department of Transportation Bureau of Transportation Statistics. The data contained the latitude and longitude coordinates for each station, so we […]
MOTD: 071816 Diesel Particulate Matter and # of Asthma-related Hospital Visits
The following visualization displays the Diesel Particulate Matter readings (colored markers) along with the number of asthma-related hospital visits for children age 0 – 17 for select Los Angeles ZIP codes. According to Dieselnet.com: Diesel particulate matter (DPM) is the most complex of diesel emissions. Diesel particulates, as defined by most emission standards, are sampled from diluted […]
MOTD: 071516 Housing Units by Census Tract and Location of Natural Springs
We used FactLook to create this visualization that displays two datasets: the Total Housing Units by Census Tract; and the location of natural springs in Jefferson County, Kentucky. Using data from the US Census Bureau’s American FactFinder, we created a layer displaying the total housing units by census tract. We then used the latitude and longitude […]
MOTD: 071416 Earthquake Activity, July 13, 2016
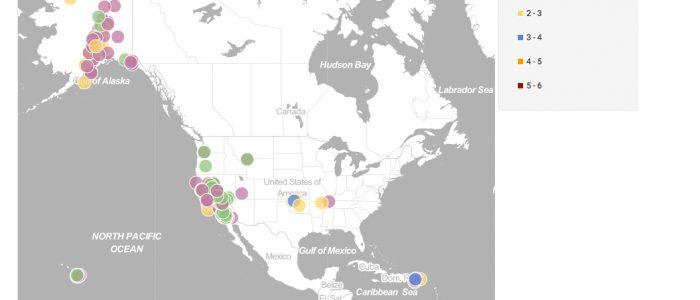
The USGS maintains a real-time database of earthquake activity across the world. We pulled data for Wednesday, July 13 and used FactLook‘s geocoding feature to plot the location and magnitude of the nearly 230 recorded earthquakes for that day. Here’s a look at the map of earthquake activity in the US on July 13, 2016. […]