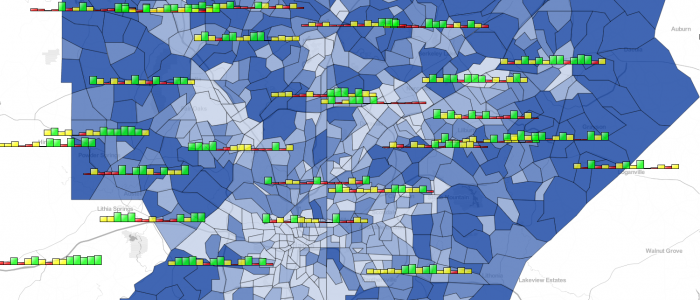
We wanted to display how well certain product categories were performing at a fictitios multi-store grocery chain. First we created a census-tract layer displaying owner-occupied home data (maker shades of blue indicate heavier ownership). We then used FactLook’s geocoding feature to pin every store’s location on the map, then used bar charts to show sales success in 15 separate product categories.
Census tract map with geocoded bar charts