We used FactLook to create this visualization that displays two datasets: the Total Housing Units by Census Tract; and the location of natural springs in Jefferson County, Kentucky. Using data from the US Census Bureau’s American FactFinder, we created a layer displaying the total housing units by census tract. We then used the latitude and longitude […]
MOTD: 071416 Earthquake Activity, July 13, 2016
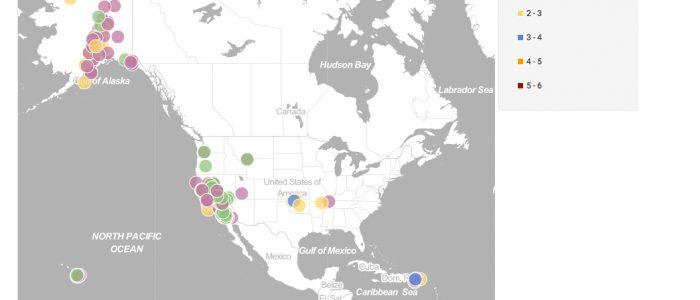
The USGS maintains a real-time database of earthquake activity across the world. We pulled data for Wednesday, July 13 and used FactLook‘s geocoding feature to plot the location and magnitude of the nearly 230 recorded earthquakes for that day. Here’s a look at the map of earthquake activity in the US on July 13, 2016. […]