Step-by-step: building a multi-metric map with geocoded locations

Multi-metric map with geocoded locations

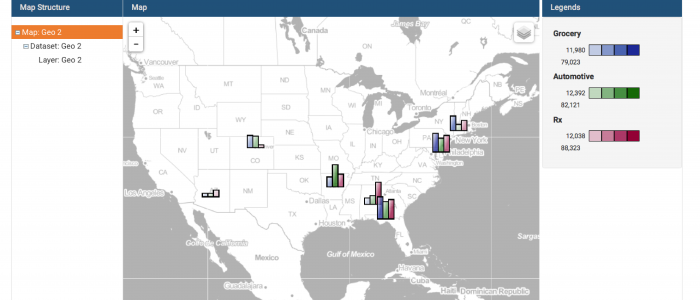
FactLook gives you the capability to assign multiple metric values to a single geocoded location which are then displayed on a map as fully-customizable bar charts.     1. Format your spreadsheet: Format your spreadsheet in the same manner as when using FactLook’s geocoding feature. In addition to the required columns of data, you’ll want […]

Read More >

State map showing regions with geocoding

FactLook Sample Map: State maps with geocoding

This map displays data about a fictitious grocery outlet. The first layer organizes the US states into different regions (West, South, etc.). The geocoded layers display each stores revenue: three breaks, ranging from red (low) to yellow (medium) to green (high). The hexagon markers represent specialty food stores participating in a pilot program to test validity.

Read More >

County Map with Geocoding

FactLook Sample Map: County with Geocoding

  This map was created to show the unemployment rate by county in Kentucky with geocoded locations of several community colleges displaying enrollment rates. Map was used to display correlation between unemployment and location of affordable schools.

Read More >