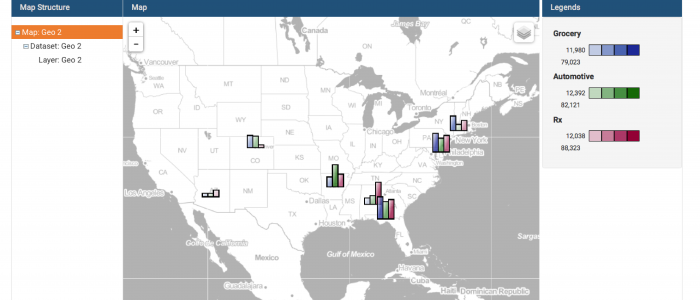
FactLook gives you the capability to assign multiple metric values to a single geocoded location which are then displayed on a map as fully-customizable bar charts. 1. Format your spreadsheet: Format your spreadsheet in the same manner as when using FactLook’s geocoding feature. In addition to the required columns of data, you’ll want […]
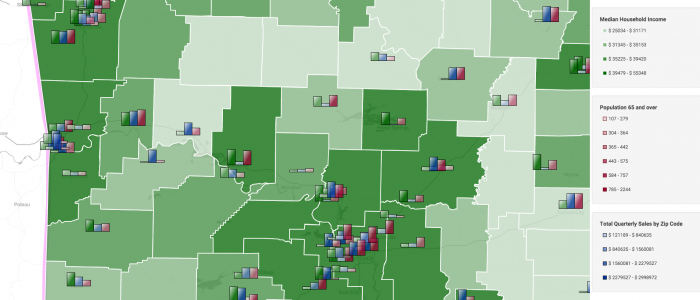
County map using bar chart to display income, sales and population demos
Arkansas map, showing median household income by county (green shading). Then the multiple-metric bar chart markers are showing grocery category sales for each store of a fictional retail chain along with population 65 years and older. The bar charts display a single metric (overall grocery sales) vs multiple-metric for individual category sales. The height of […]


