We were curious as to where rents are highest in notoriously high-rent San Francisco. We found that data, broken out by neighborhood, at rentjungle.com. We then used FactLook’s geocoding feature to plot that data by latitude and longitude. Finally, we created another layer displaying median household income with data obtained via the US Census Bureau. […]
County map using bar chart to display income, sales and population demos
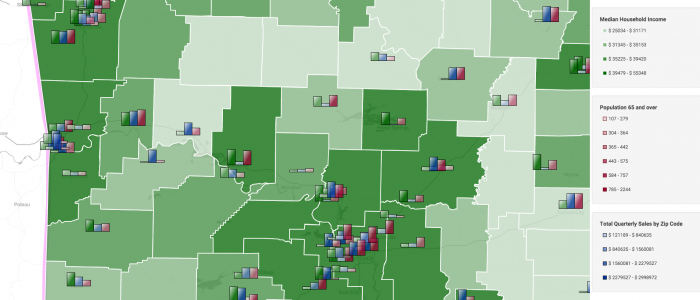
Arkansas map, showing median household income by county (green shading). Then the multiple-metric bar chart markers are showing grocery category sales for each store of a fictional retail chain along with population 65 years and older. The bar charts display a single metric (overall grocery sales) vs multiple-metric for individual category sales. The height of […]