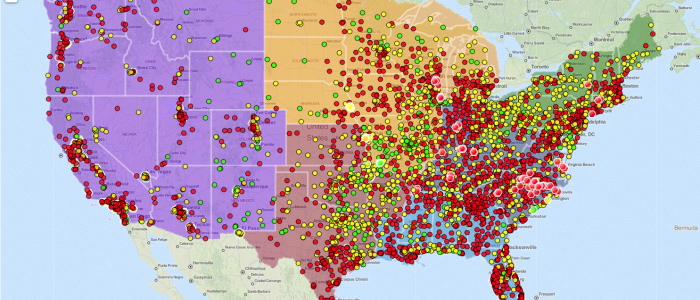
This map displays data about a fictitious grocery outlet. The first layer organizes the US states into different regions (West, South, etc.). The geocoded layers display each stores revenue: three breaks, ranging from red (low) to yellow (medium) to green (high). The hexagon markers represent specialty food stores participating in a pilot program to test validity.
State map showing regions with geocoding