Need a stronger cell signal in Florida? We were curious about the location and distribution of cell towers across the state and found that data via the U.S. Department of Homeland Security’s Homeland Infrastructure Foundation-Level Data site. We started out creating a data viz showing the population per square mile for Florida by county. We […]
MOTD: 092316 — US Auto Accident Fatalities 2015
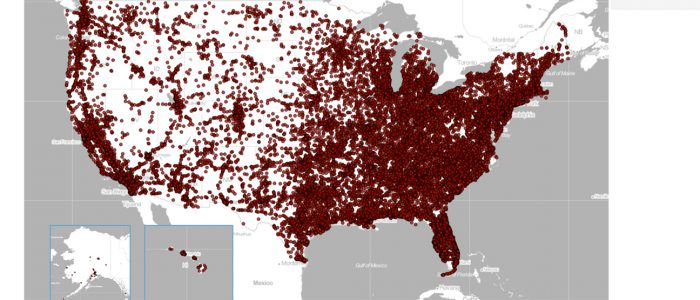
The US Department of Transportation’s National HighwayTraffic Safety Administration maintains a nationwide census of fatal injuries suffered in motor vehicle traffic crashes. The Fatality Analysis Reporting System (FARS) can be accessed here. Using the FARS data and FactLook’s geocoding feature, we plotted every auto accident by the number of fatalities. The first data viz we created is for […]
MOTD: CA Exceptional Drought and Location of Golf Courses
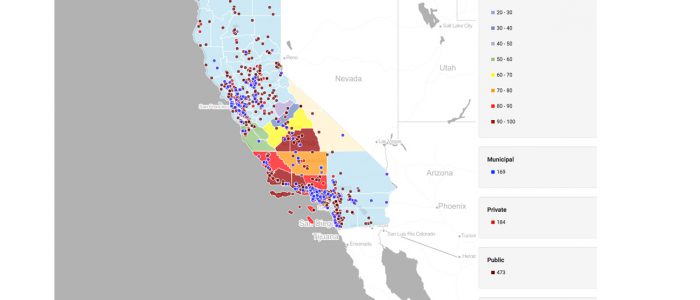
It’s tough watching loved ones suffer. If golf is your game and your favorite course is in drought-stricken California, odds are you’ve seen verdant fairways turn ochre and watched balls skid across rock hard greens. According to CBS.com, “There are 866 golf courses in California. An average 18-hole course uses 90 million gallons of water […]
072016 – Major US Dams by Year Constructed
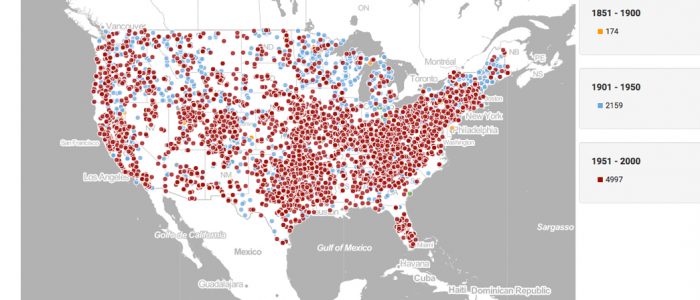
We pulled data from the US Bureau of Transportation Statistics which has compiled a spreadsheet of major dams in the United States that are 50 feet or more in height, or with a normal storage capacity of 5,000 acre-feet or more, or with a maximum storage capacity of 25,000 acre-feet or more. We then filtered the data […]
MOTD: 071916 Amtrak Stations
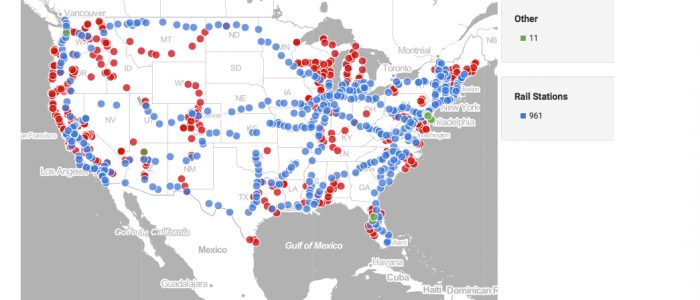
This visualization displays the location of Amtrak Stations across the United States. The Federal Railroad Administration’s (FRA) Amtrak Station database organizes this data by Bus, Rail and Other. We obtained the data from the US Department of Transportation Bureau of Transportation Statistics. The data contained the latitude and longitude coordinates for each station, so we […]
MOTD: 071516 Housing Units by Census Tract and Location of Natural Springs
We used FactLook to create this visualization that displays two datasets: the Total Housing Units by Census Tract; and the location of natural springs in Jefferson County, Kentucky. Using data from the US Census Bureau’s American FactFinder, we created a layer displaying the total housing units by census tract. We then used the latitude and longitude […]
MOTD: 071416 Earthquake Activity, July 13, 2016
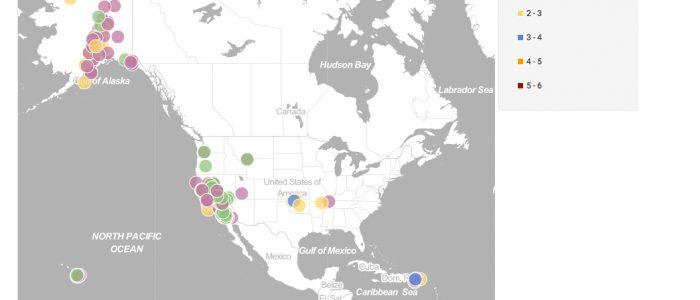
The USGS maintains a real-time database of earthquake activity across the world. We pulled data for Wednesday, July 13 and used FactLook‘s geocoding feature to plot the location and magnitude of the nearly 230 recorded earthquakes for that day. Here’s a look at the map of earthquake activity in the US on July 13, 2016. […]
Map of the Day: New Jersey Mall Sales, 2012, by select counties … and Tiffany!
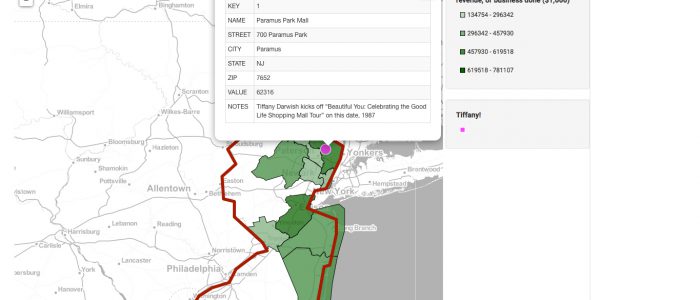
On this day, courtesy of History.com: “A 16-year-old aspiring pop star named Tiffany Darwish had a self-titled debut album on a major record label that was gathering dust on record store shelves around the country. What transformed Tiffany the album into a quadruple-Platinum smash hit and Tiffany the singer from a flop into a pop idol was a […]
Map of the Day: Active KKK Chapters in Mississippi
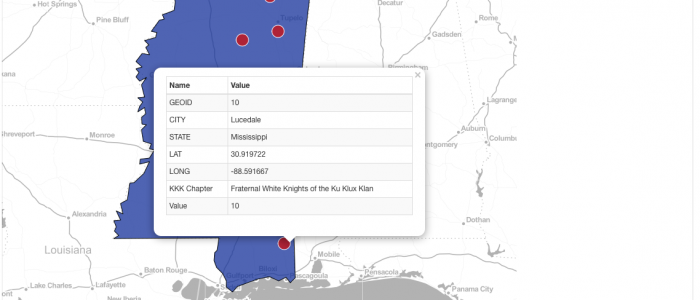
On June 21, 1964, three civil rights field workers went missing in Neshoba County in central Mississippi. It was later determined that Michael Schwerner, Andrew Goodman and James Chaney had been killed by members of the Ku Klux Klan. The disappearance and murder of the three Congress of Racial Equality (CORE) workers drew national attention […]
Step-by-step: building a multi-metric map with geocoded locations
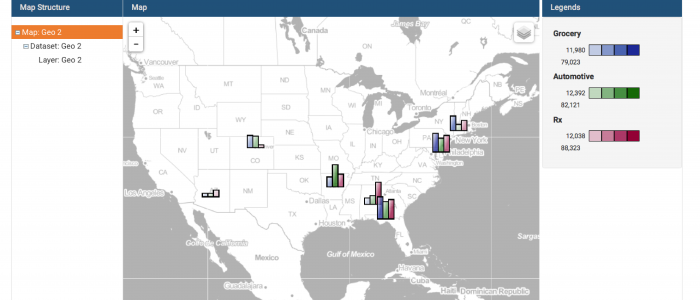
FactLook gives you the capability to assign multiple metric values to a single geocoded location which are then displayed on a map as fully-customizable bar charts. 1. Format your spreadsheet: Format your spreadsheet in the same manner as when using FactLook’s geocoding feature. In addition to the required columns of data, you’ll want […]