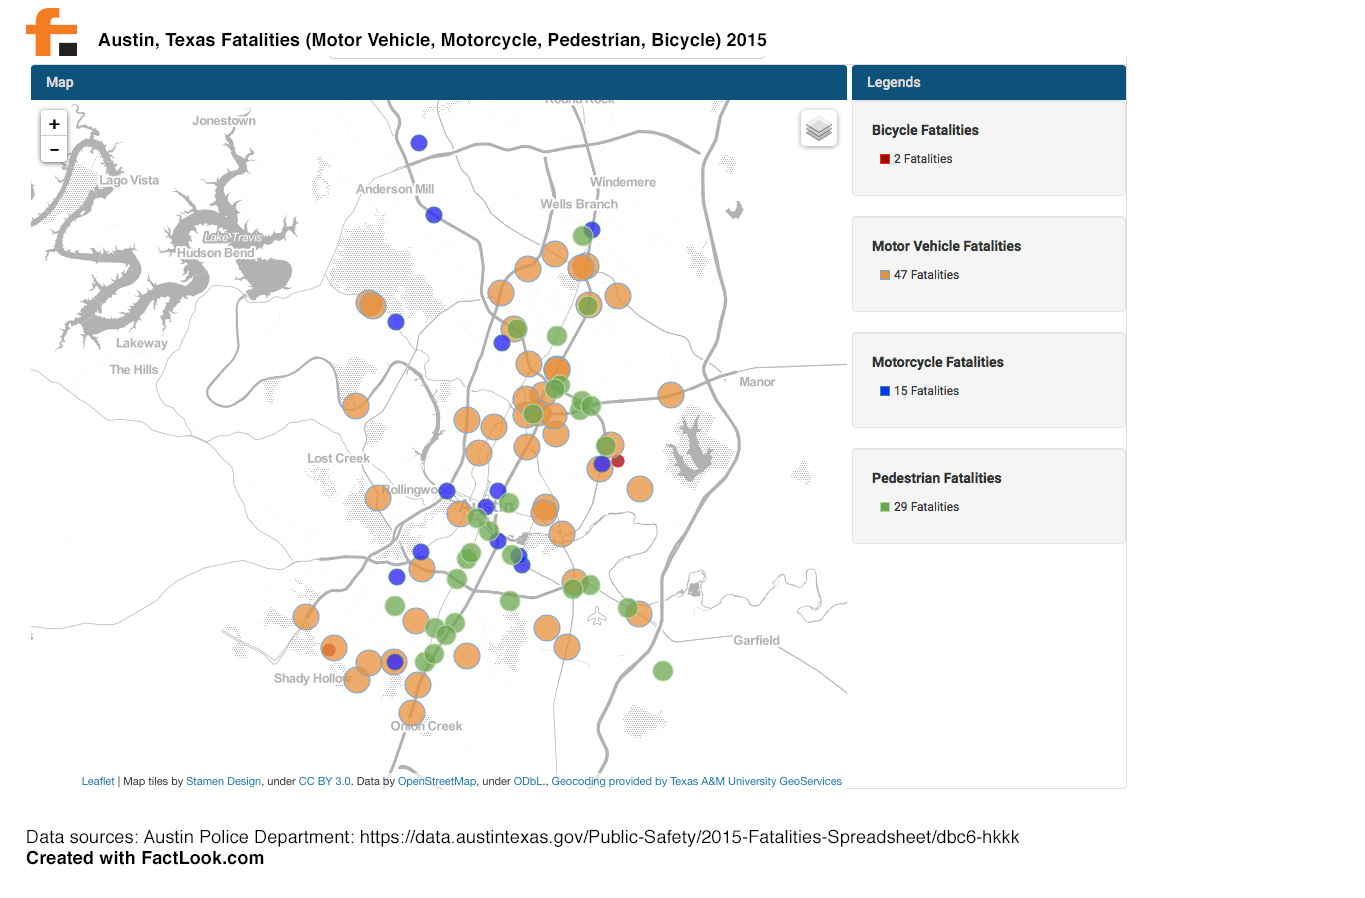
We created this visualization using data from the Austin (TX) Police Department‘s website. The APD maintains a database of motor vehicle, bicycle, motorcycle and pedestrian fatalities. This data covers the period from Jan. 1 through Dec. 31, 2015.
We used FactLook‘s geocoding feature to place pins on the map indicating one of four types of incidents: motor vehicle, motorcycle, pedestrian and bicycle. We color coded each of the accident types, and made those types with the highest number of incidents larger by adjusting their styles.
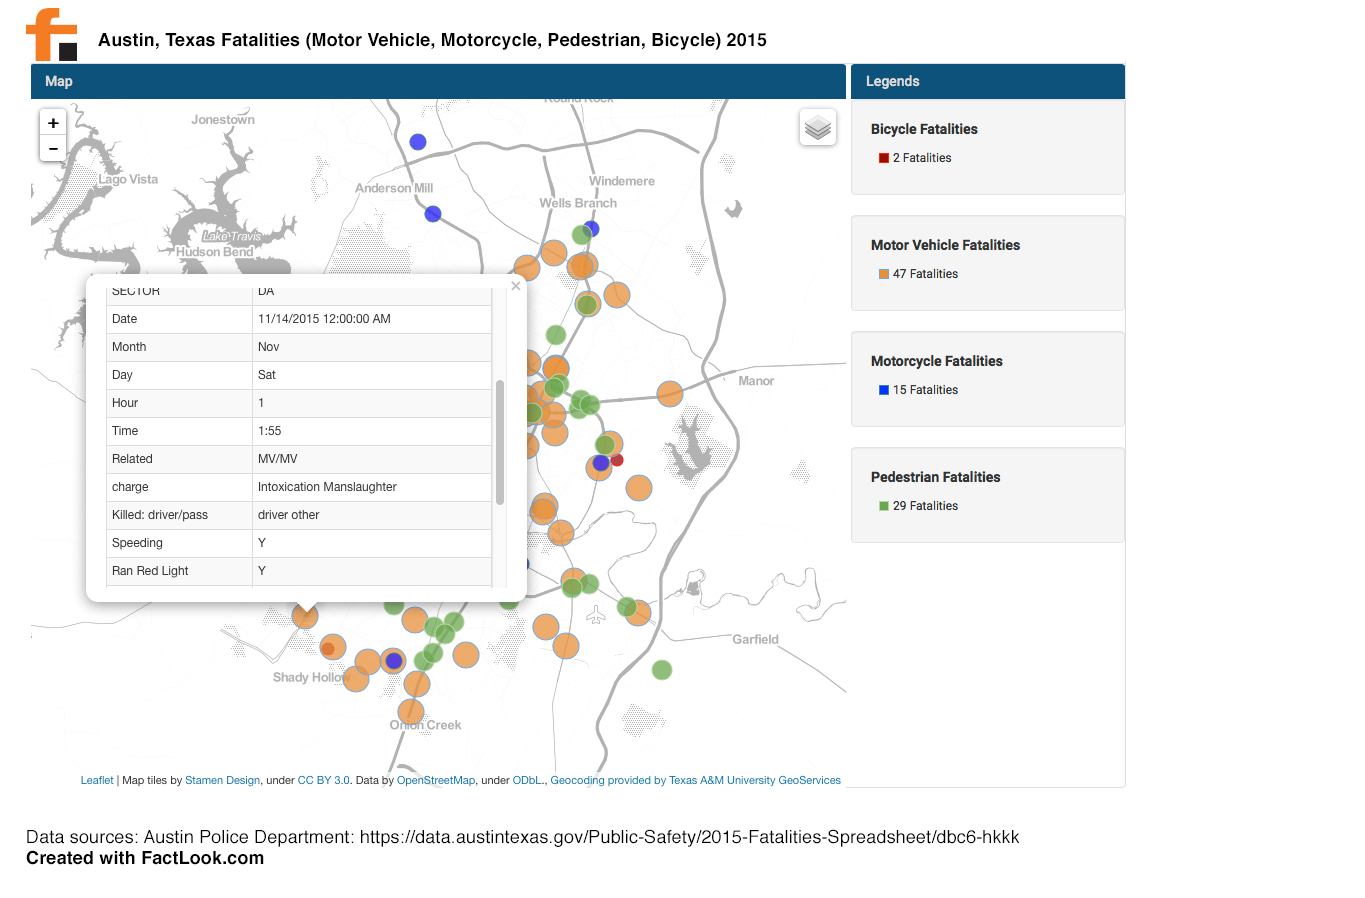
We also attached incident data from the APD report to each pin.
Data Source: 2015 Austin, TX Fatalities