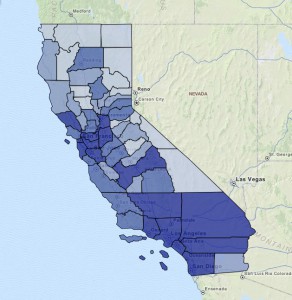
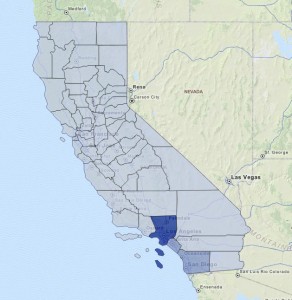
These are the two methods for creating “breaks” employed by the FactLook wizard.
A break is a group of data within a value range that you can set manually or allow the FactLook wizard to set for you. An example of a set of breaks is:
- 1 – 99
- 100 – 149
- 150 – 400
These groups or “breaks” are visibly displayed on your map via color or other identifier, and can be adjusted using the options in the dataset’s Property Style Settings. The FactLook wizard allows you to set as many breaks as you want.
Equal Size Groups takes the raw data and distributes into equal sized groups for the map (ex: 58 datapoints for 58 counties in CA ÷ 4 breaks = 14.5 counties for each shade of blue). The first 3 breaks are assigned 14 counties and the last break 16 counties.
Equal Size Data Ranges distributes the raw data across the number of breaks with an equal range between (ex: population data values for the map range from 713 to 6,318,306 per county, so 6,318,306 – 713 = 6,317,593 ÷ 4 breaks = 1,579,398 range for each break).


