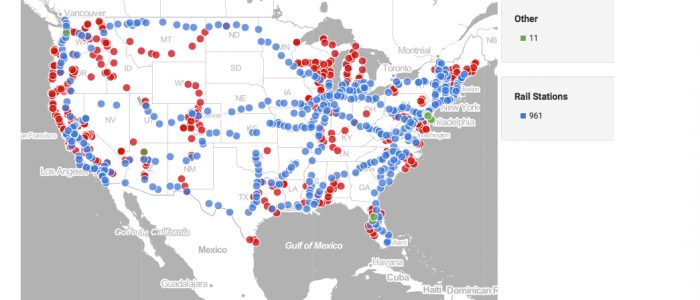
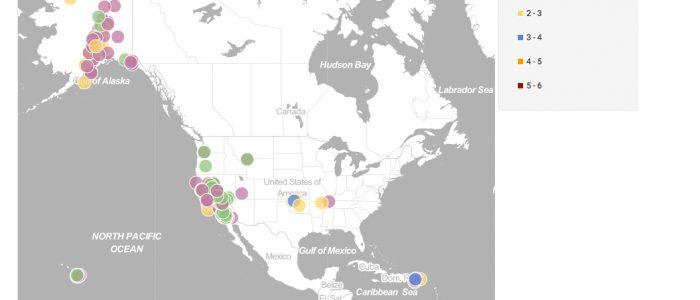
This visualization displays the location of Amtrak Stations across the United States. The Federal Railroad Administration’s (FRA) Amtrak Station database organizes this data by Bus, Rail and Other. We obtained the data from the US Department of Transportation Bureau of Transportation Statistics. The data contained the latitude and longitude coordinates for each station, so we […]
MOTD: 071816 Diesel Particulate Matter and # of Asthma-related Hospital Visits
The following visualization displays the Diesel Particulate Matter readings (colored markers) along with the number of asthma-related hospital visits for children age 0 – 17 for select Los Angeles ZIP codes. According to Dieselnet.com: Diesel particulate matter (DPM) is the most complex of diesel emissions. Diesel particulates, as defined by most emission standards, are sampled from diluted […]
MOTD: 071516 Housing Units by Census Tract and Location of Natural Springs
We used FactLook to create this visualization that displays two datasets: the Total Housing Units by Census Tract; and the location of natural springs in Jefferson County, Kentucky. Using data from the US Census Bureau’s American FactFinder, we created a layer displaying the total housing units by census tract. We then used the latitude and longitude […]
MOTD: 071416 Earthquake Activity, July 13, 2016
The USGS maintains a real-time database of earthquake activity across the world. We pulled data for Wednesday, July 13 and used FactLook‘s geocoding feature to plot the location and magnitude of the nearly 230 recorded earthquakes for that day. Here’s a look at the map of earthquake activity in the US on July 13, 2016. […]
MOTD: 071316 California West Nile Virus Cases by County
It’s summer and the mosquitos are biting. The following visualization displays all reported cases of West Nile Virus in California by county from 2006 to present. Data Source: California Department of Health & Humana Services — https://chhs.data.ca.gov/
MOTD: 071216 Austin, TX Fatalities 2015
We created this visualization using data from the Austin (TX) Police Department‘s website. The APD maintains a database of motor vehicle, bicycle, motorcycle and pedestrian fatalities. This data covers the period from Jan. 1 through Dec. 31, 2015. We used FactLook‘s geocoding feature to place pins on the map indicating one of four types of […]
MOTD: 071116 – Craft Vodka Distilleries by State
FactLook was hired to produce a visualization displaying the concentration of craft distilleries across the US with a focus on those distilleries producing vodka. We found the data we needed at the American Distilling Institute. The ADI’s database had listings for 158 unique distilleries with vodka products. The state with the largest number of craft […]
MOTD: 070816 – Living Large in AZ
We turned to American Fact Finder to see how many palatial estates there are in Arizona. So we pulled stats on homes with more than 8 bedrooms as a percentage of all homes in each county in AZ. We then pulled data on the top residential real estate brokers in Arizona. All ten were in […]
Map of the Day: 070716 – Native Americans on Death Row
FactLook.com was recently hired to produce a thematic map showing which of the US states had individuals on death row who claim Native American as their race. We found the data needed to build the map at DeathPenaltyInfo.org. The largest number of Native Americans on death row were incarcerated in California, which has the largest […]
Map of the Day: 070516 – High School Tennis Participation by State
On this day in 1975, Arthur Ashe defeated Jimmy Connors to become the first African American tennis player to win Wimbledon. Connors was heavily favored but fell to Ashe’s strategy of only giving Connors “junk” to hit. Ashe won the match 6-1, 6-1, 5-7, 6-4. FactLook was curious to see which state might produce the […]