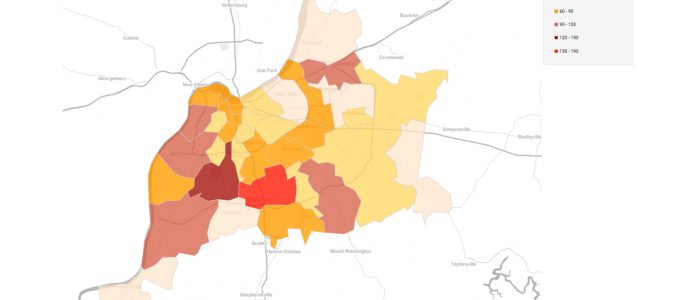
We found a dataset on Data.gov pertaining to the number of arrests made by the LMPD in Louisville, KY for the first half of 2016. When turned into a data visualization, that data showed an unmistakable trend: for virtually every crime type (assault, homicide, larceny, etc.), the heaviest concentration of arrests occurred in ZIP codes west […]
MOTD: 081916 National Aviation Day
August 19 is National Aviation Day — designated in 1939 by FDR to honor aviation’s pioneers. To celebrate, we pulled data listing every runway in the United States and its territories from the Department of Homeland Security via OpenData.gov. In addition to listing the latitude and longitude of the 6,839 runways, the dataset included information […]
MOTD: 081816 US Pipeline Accidents – Hazardous Liquids From 2010 – 15 and > 500 Barrels
There have been 2,577 pipeline accidents involving hazardous liquids in the US in the years from 2010 to 2015, according to data published by the U.S. Pipeline and Hazardous Materials Safety Administration. Of those accidents, 148 involved the unintentional release of hazardous liquids in excess of 500 barrels. For reference, one barrel equals 42 US gallons. […]
MOTD: 081716 KY High School Grad or Equivalent with Location of Selected Community College Campuses
FactLook was asked by a client in the higher education field to create a data visualization displaying the geographic distribution of individuals in Kentucky possessing a high school diploma or the equivalent. We mapped those values by county using data found through the US Census Bureau’s American FactFinder. We then plotted the location of several community […]
MOTD: 081616 — Of Rats & Restaurants
The NYC Department of Health and Mental Hygiene (DOHMH) maintains a database of rat inspections at public and private buildings. We downloaded the inspection data for the first half of 2016, and used FactLook’s Latitude/Longitude pin tool to plot two variables: “Active Rat Signs” and “Bait Applied.” The department definitions for the two are: Active Rat Signs […]
MOTD: 081516 Revenue of Promoters of Sporting Events with Facilities (NAICS 711310) and Location of US Sports Arena, Tracks and Stadiums
With college football season just around the corner, we wanted to plot the location of the largest football stadiums in the US. The hunt for that info led us to a list of all major sports stadiums and arenas, a dataset maintained by the Dept. of Homeland Security. Curious as to the economic impact of these arenas, […]
MOTD: 081216 State Corporate Tax Rates and Location of Fortune 500 Corporate Offices
The Tax Foundation provides state corporate income tax rate data for the 44 states that levy corporate income taxes. Four states (Nevada, Ohio, Texas and Washington) impose gross receipts instead of corporate income taxes. South Dakota and Wyoming are the only states that do not levy a corporate income or gross receipts tax. We were interested […]
MOTD: 081116 Non-Gasoline Alternative Fueling Stations
The US Department of Energy Alternative Fuels Data Center maintains a database of non-gasoline fueling stations where vehicles that run on biodiesel, CNG, electric, ethanol, hydrogen, LNG, and/or propane can fill up. The database is meant to assist individuals and vehicle fleet managers and drivers develop strategies for conserving fuel. We used FactLook to pin the more than […]
MOTD: 081016 Percent Below Poverty Level, Louisiana, Arkansas and Mississippi by ZIP Code
This visualization displays the percent of the population of people living below the poverty level in Arkansas, Louisiana and Mississippi by ZIP code. The data was obtained from the US Census Bureau’s American Community Survey 2014.
MOTD: 080916 Individuals Claiming Brazilian Ancestry by US County
In the spirit of the Olympic Games taking place in Rio, we wanted to map where the largest concentrations of people of Brazilian ancestry are living in the US. The map below is the result: data courtesy of the US Census Bureau, broken down by county and using colors found in the Brazilian flag to […]