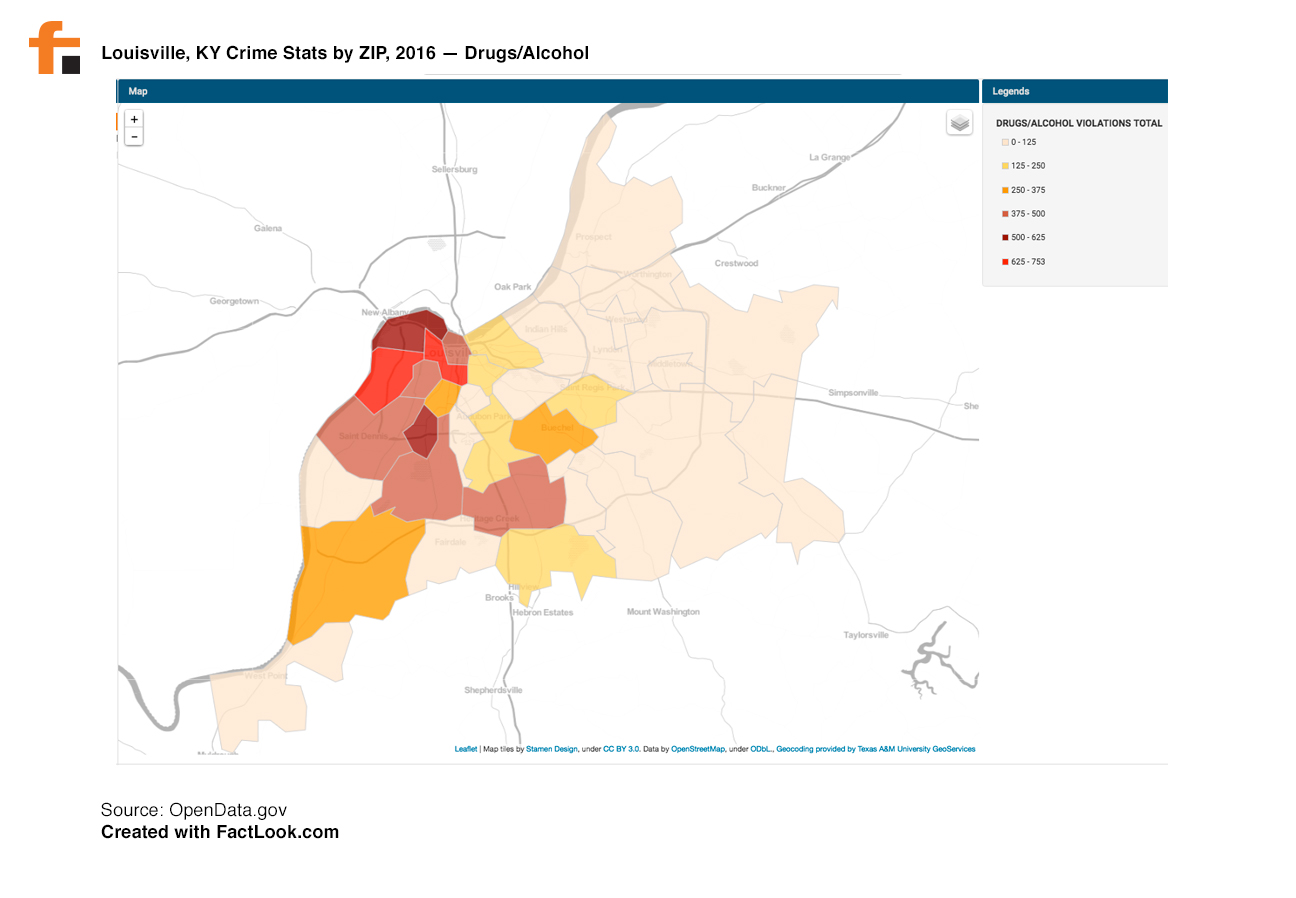
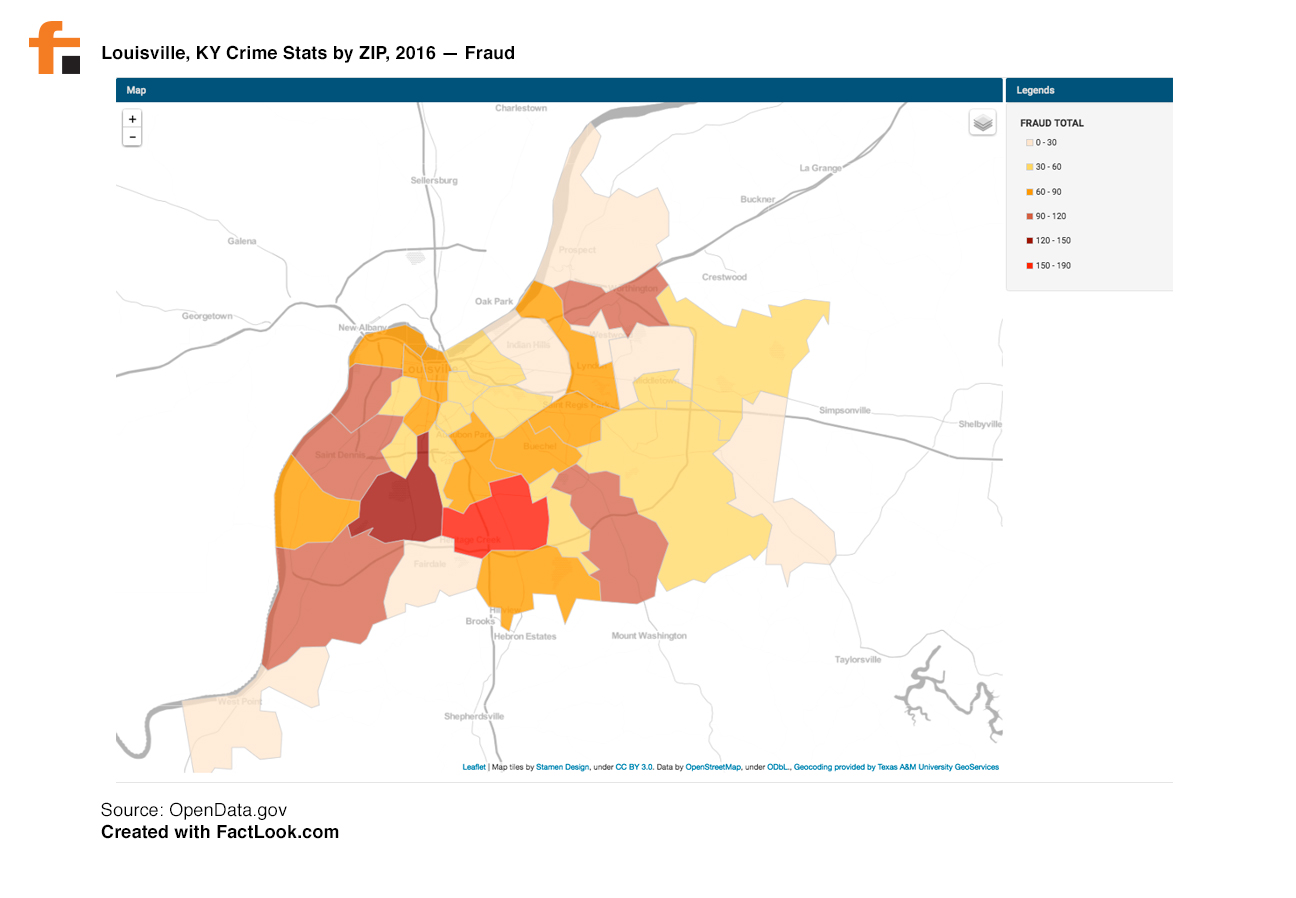
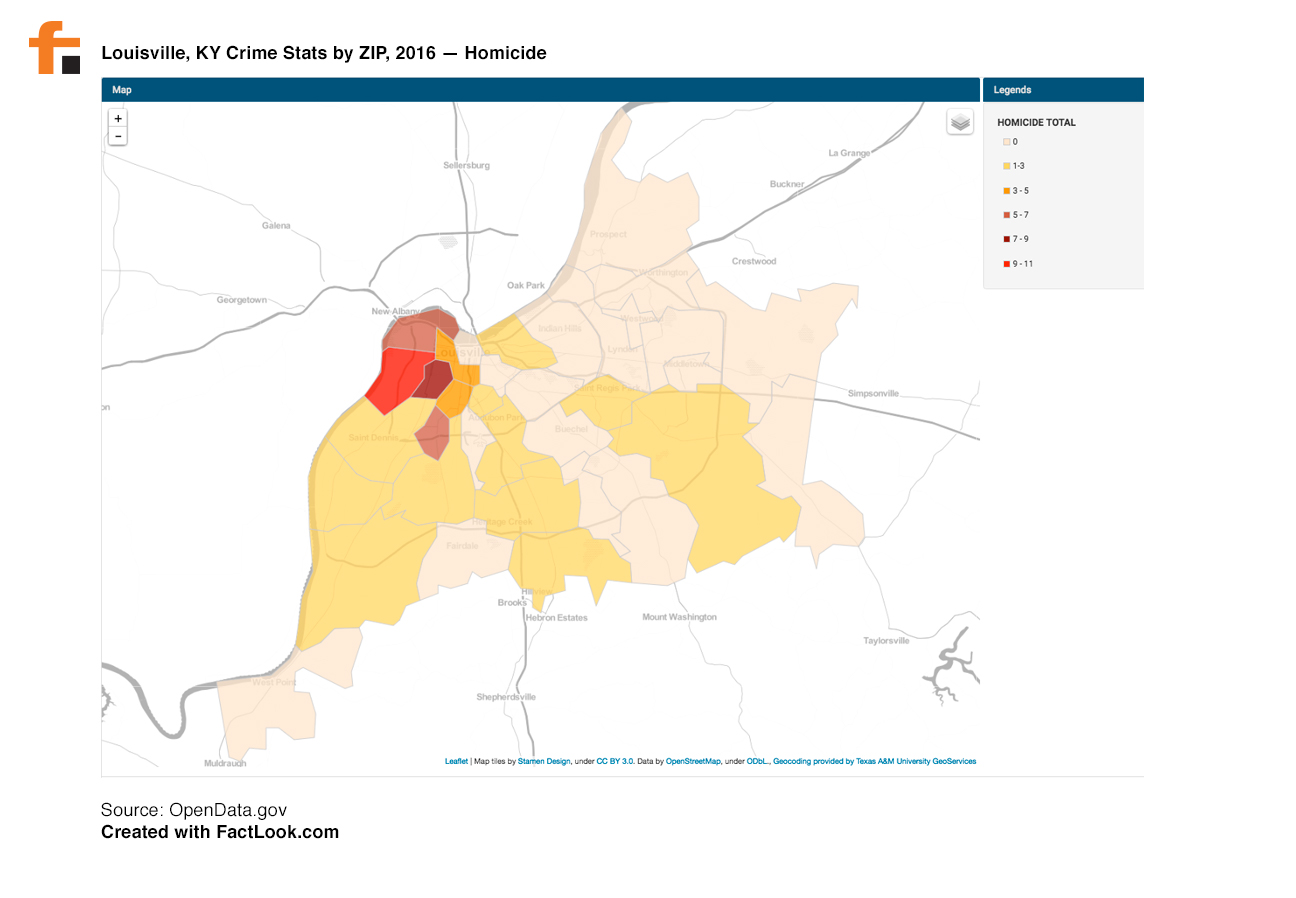
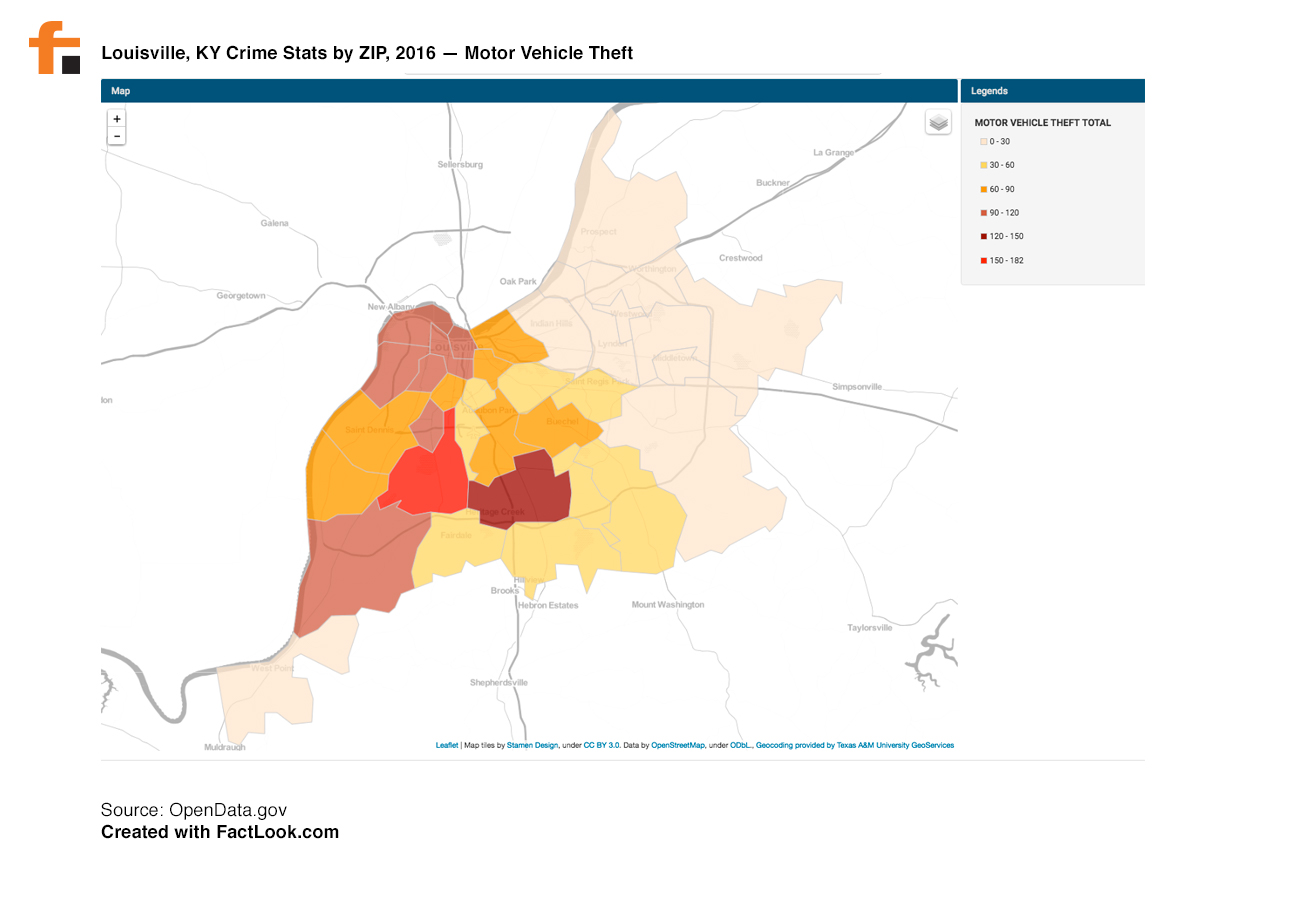
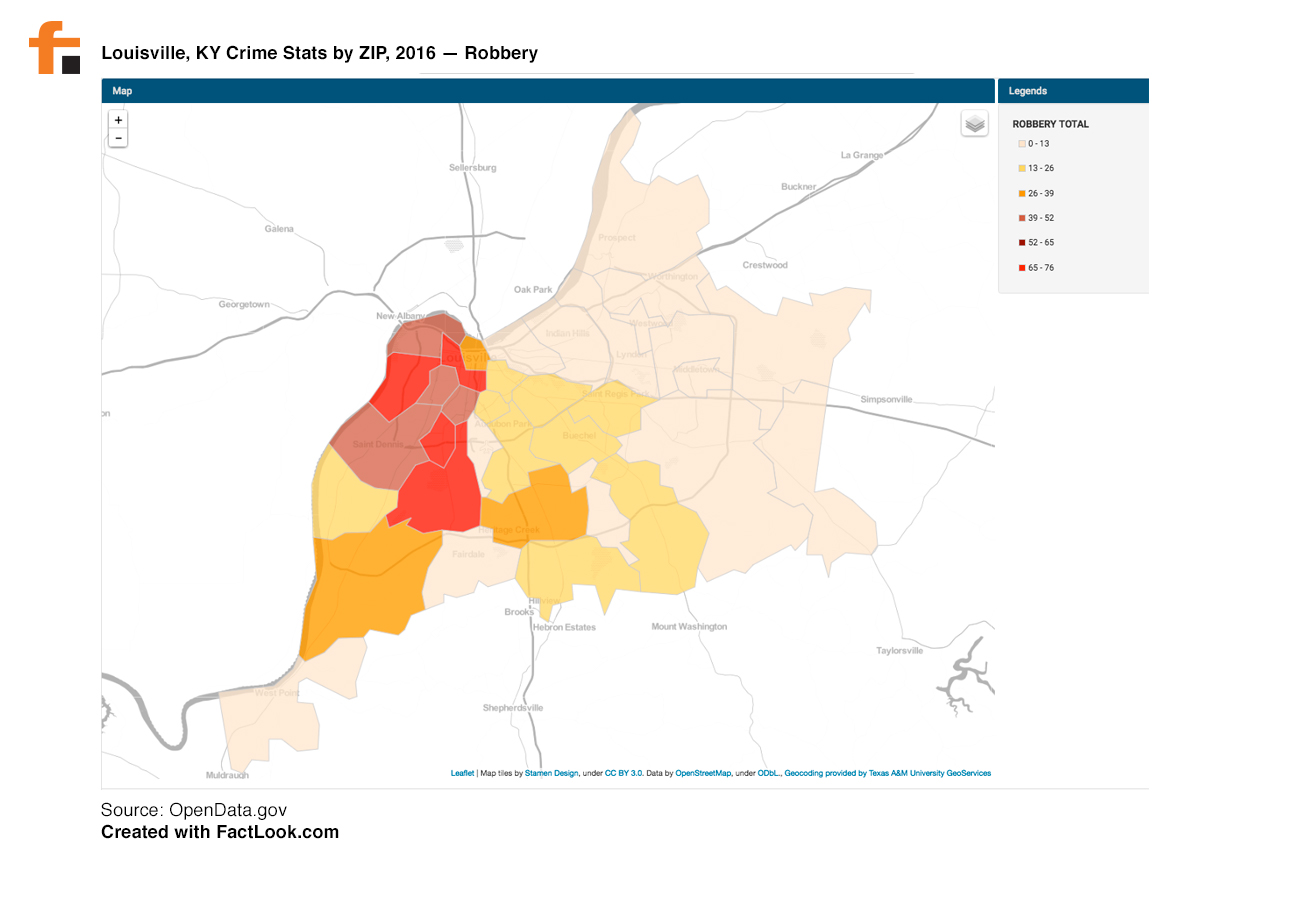
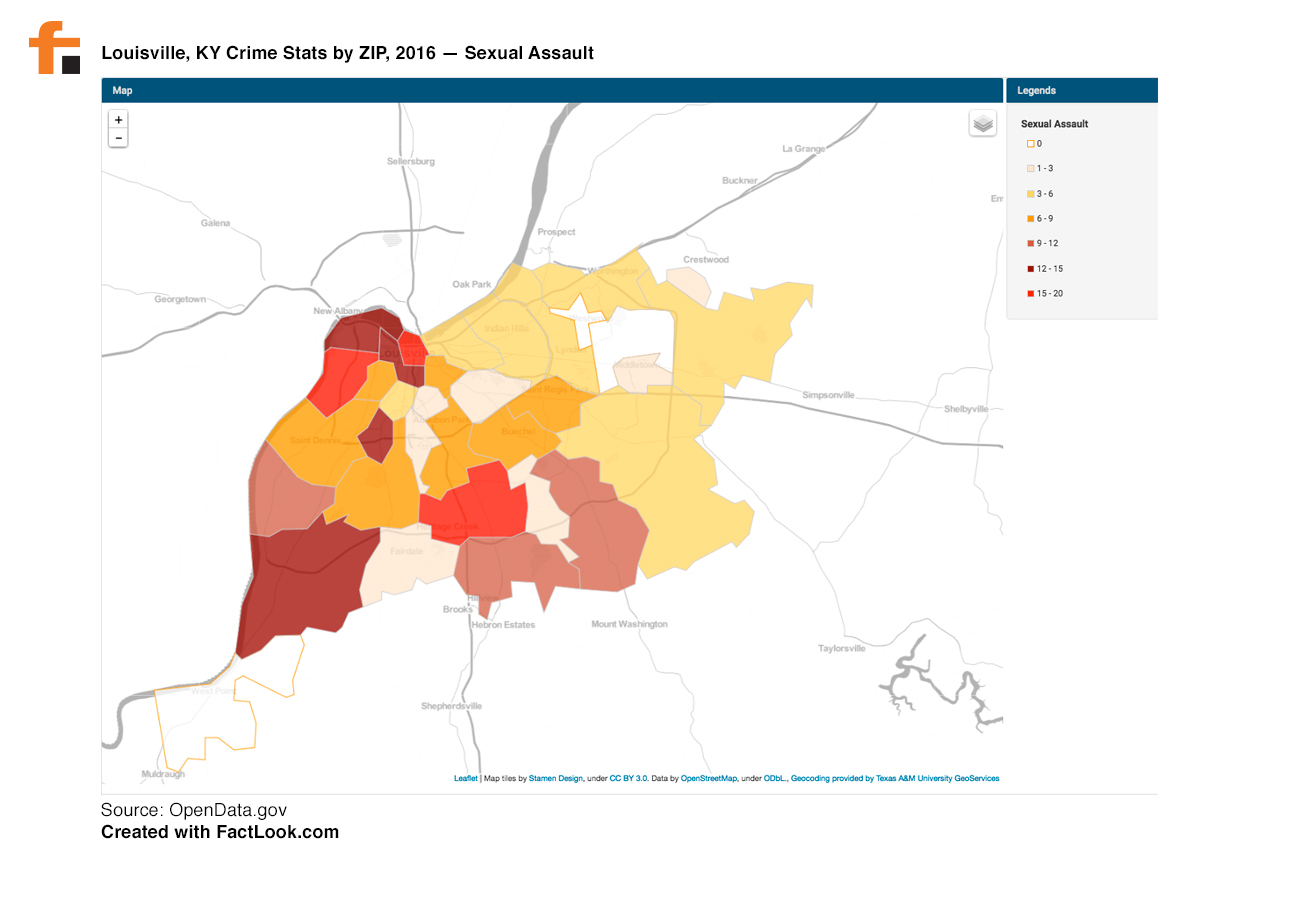
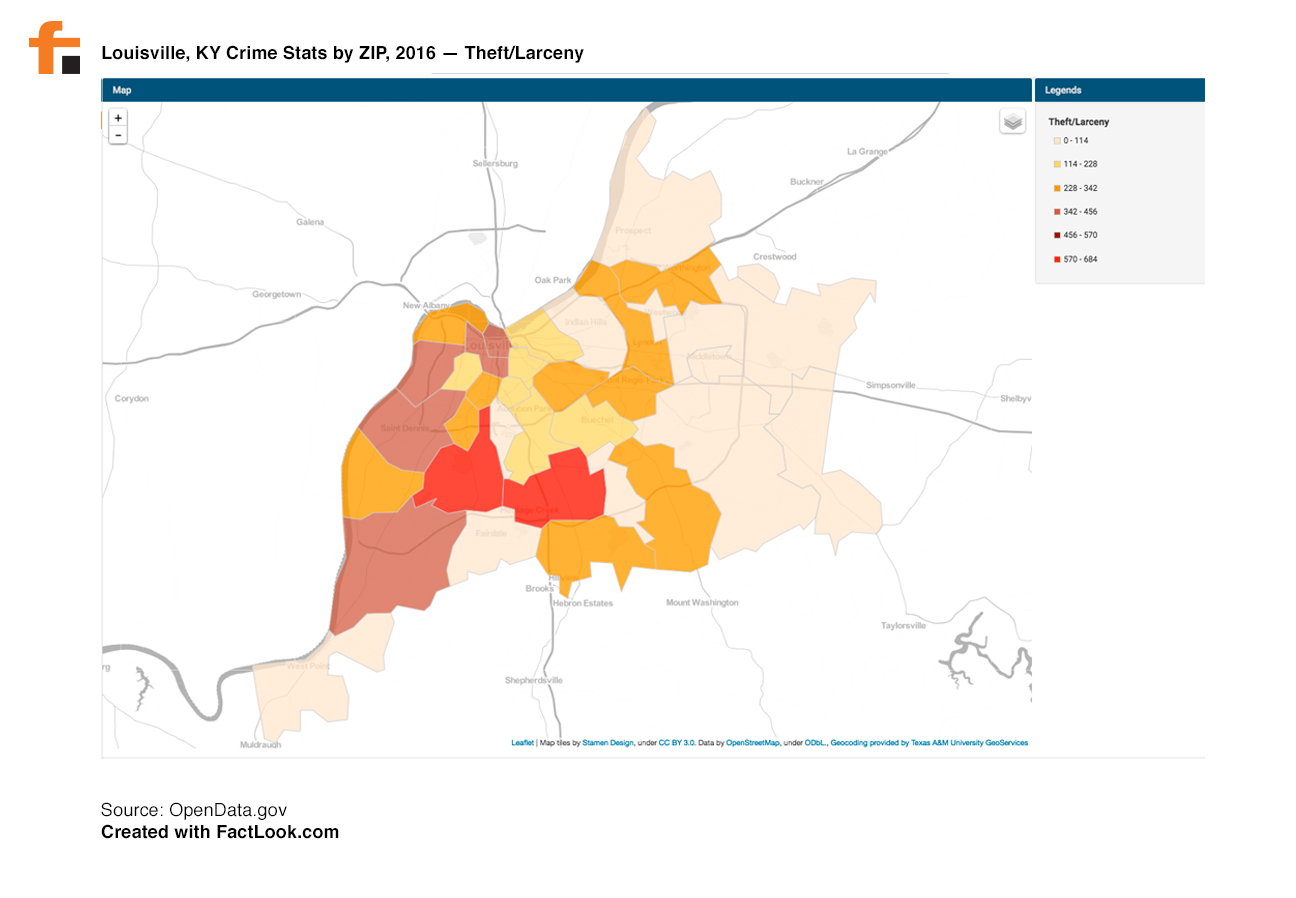
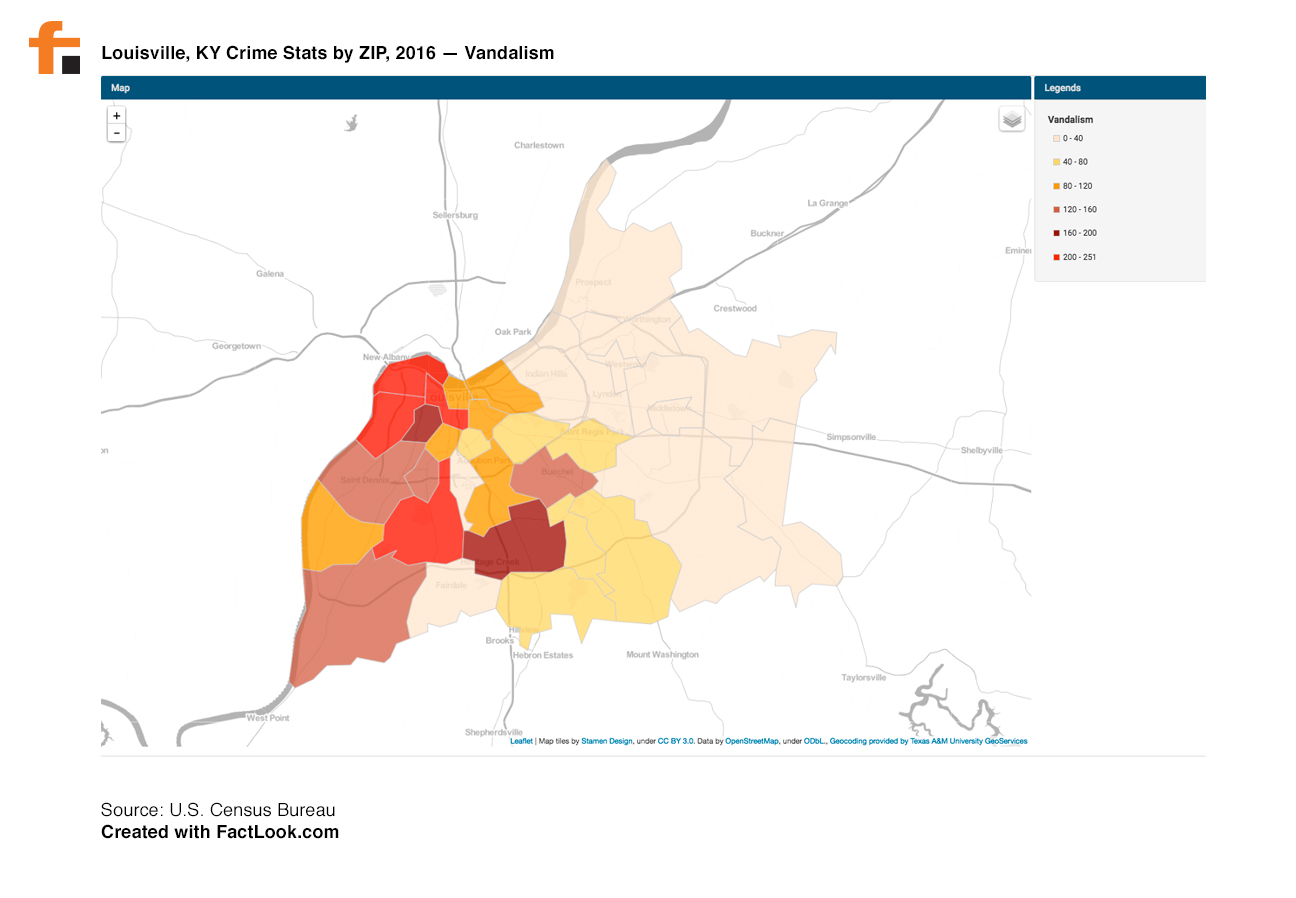
We found a dataset on Data.gov pertaining to the number of arrests made by the LMPD in Louisville, KY for the first half of 2016. When turned into a data visualization, that data showed an unmistakable trend: for virtually every crime type (assault, homicide, larceny, etc.), the heaviest concentration of arrests occurred in ZIP codes west of I-65. The interstate runs north and south through the center of Louisville. To better understand the trend, we created an additional map showing poverty rate by ZIP code using data from the U.S. Census Bureau. You’ll find that visualization at the end of this post.
First, here are twelve crime visualizations (Click to View Large):
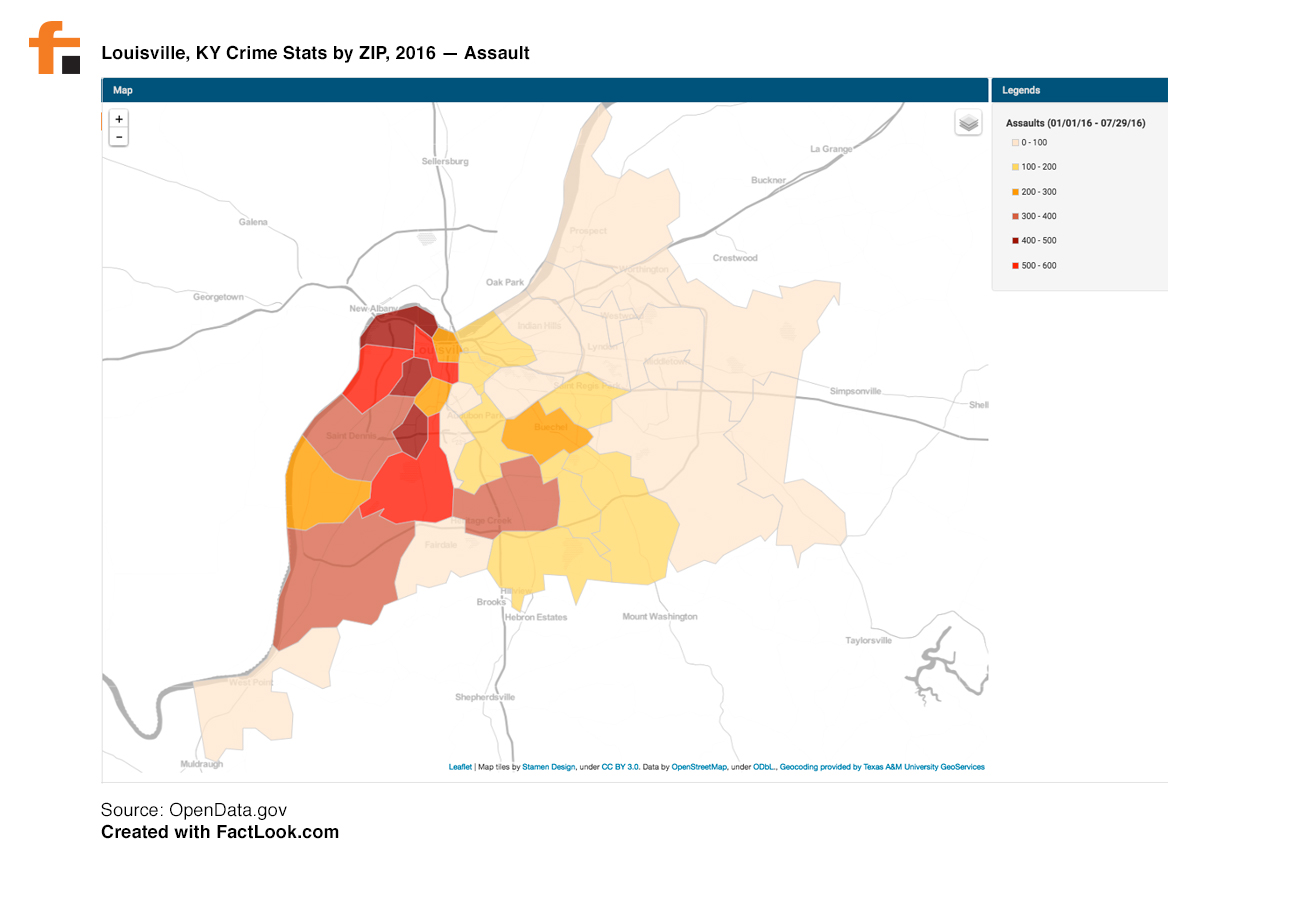
1. Assault:
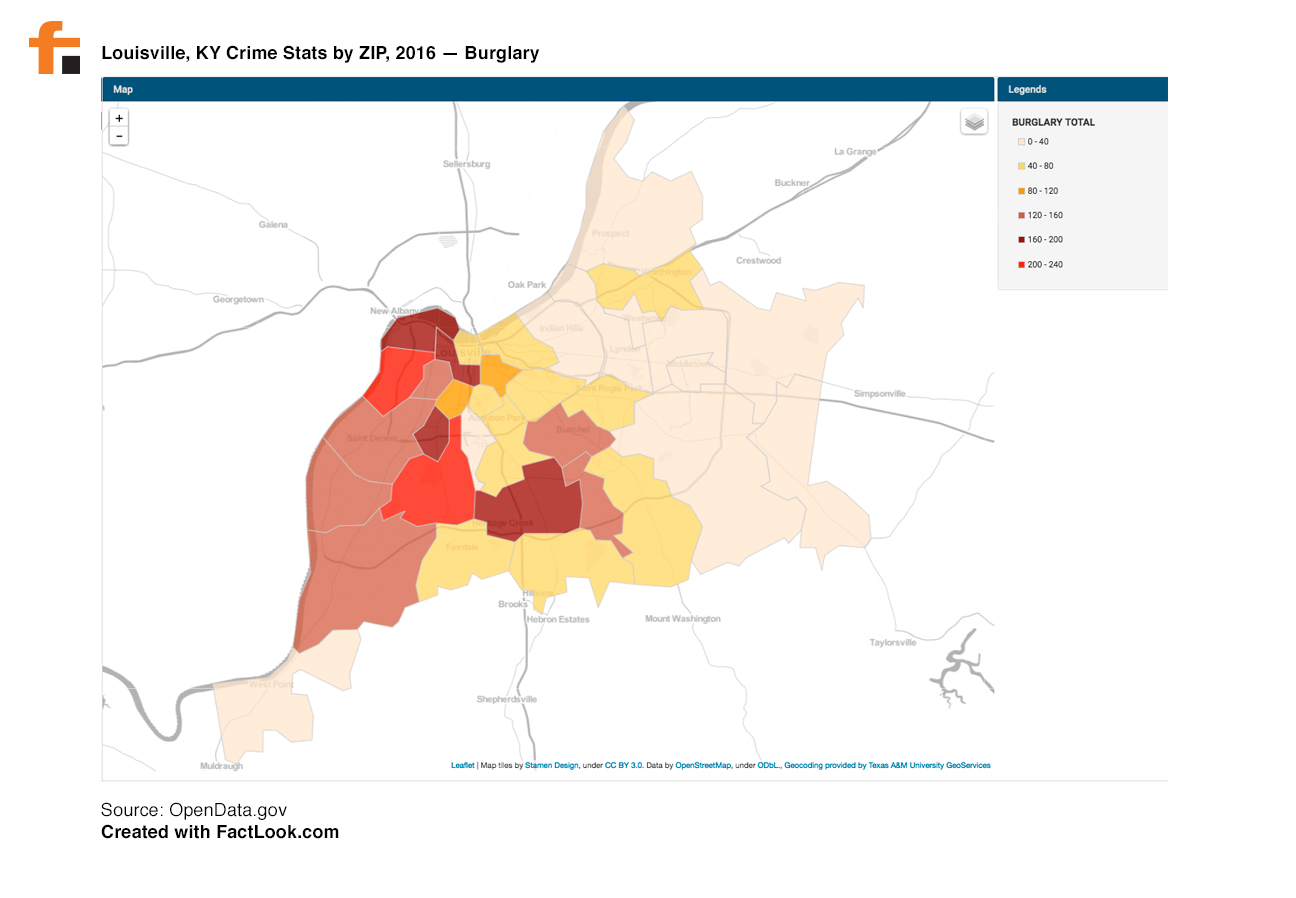
2. Burglary:
3. Drugs/Alcohol:
4. Fraud:
5. Homicide:
6. Motor Vehicle Theft:
7. Robbery:
8. Sexual Assault:
9. Theft/Larceny:
10. Vandalism:
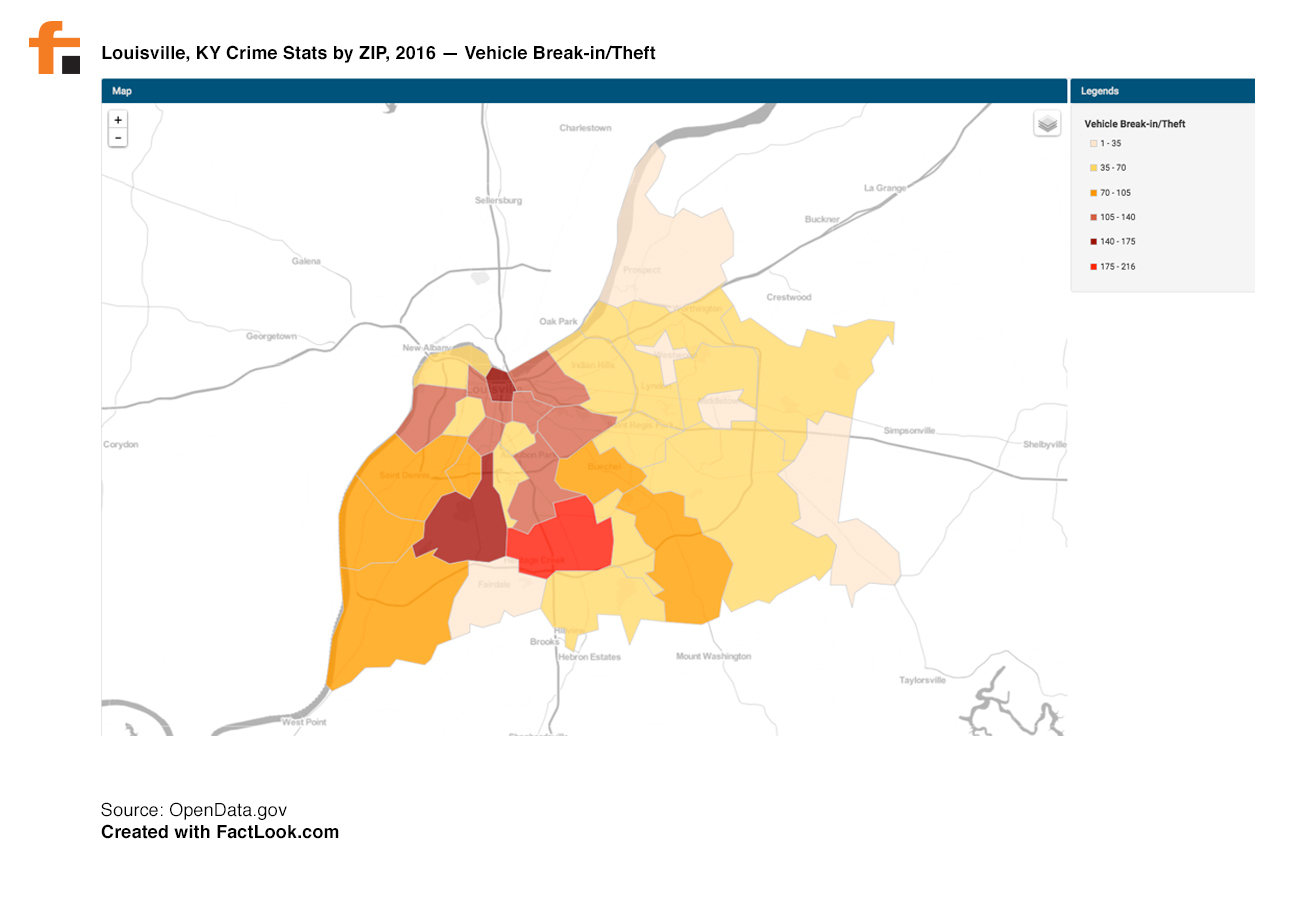
11. Vehicle Break-in/Theft:
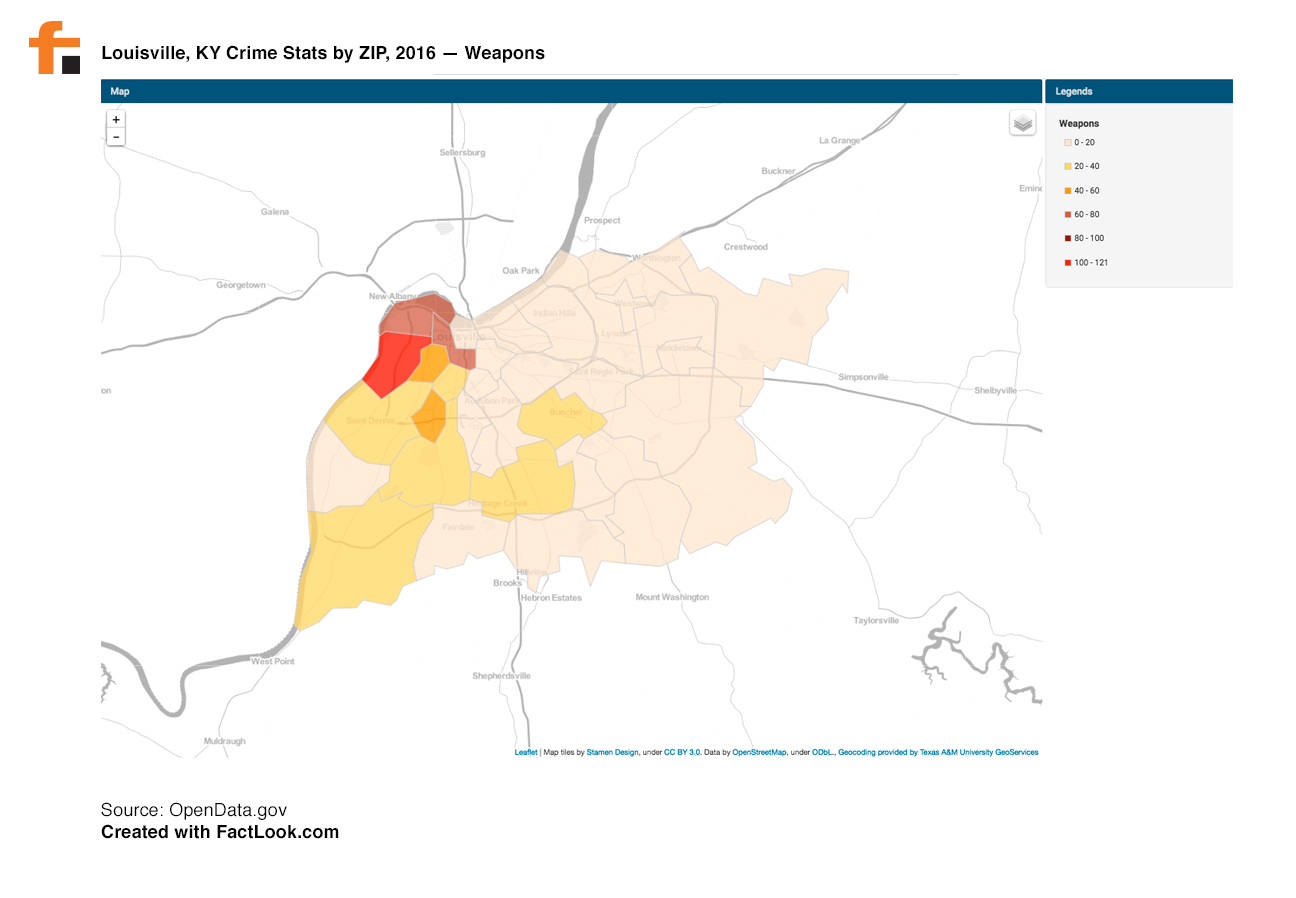
12. Weapons:
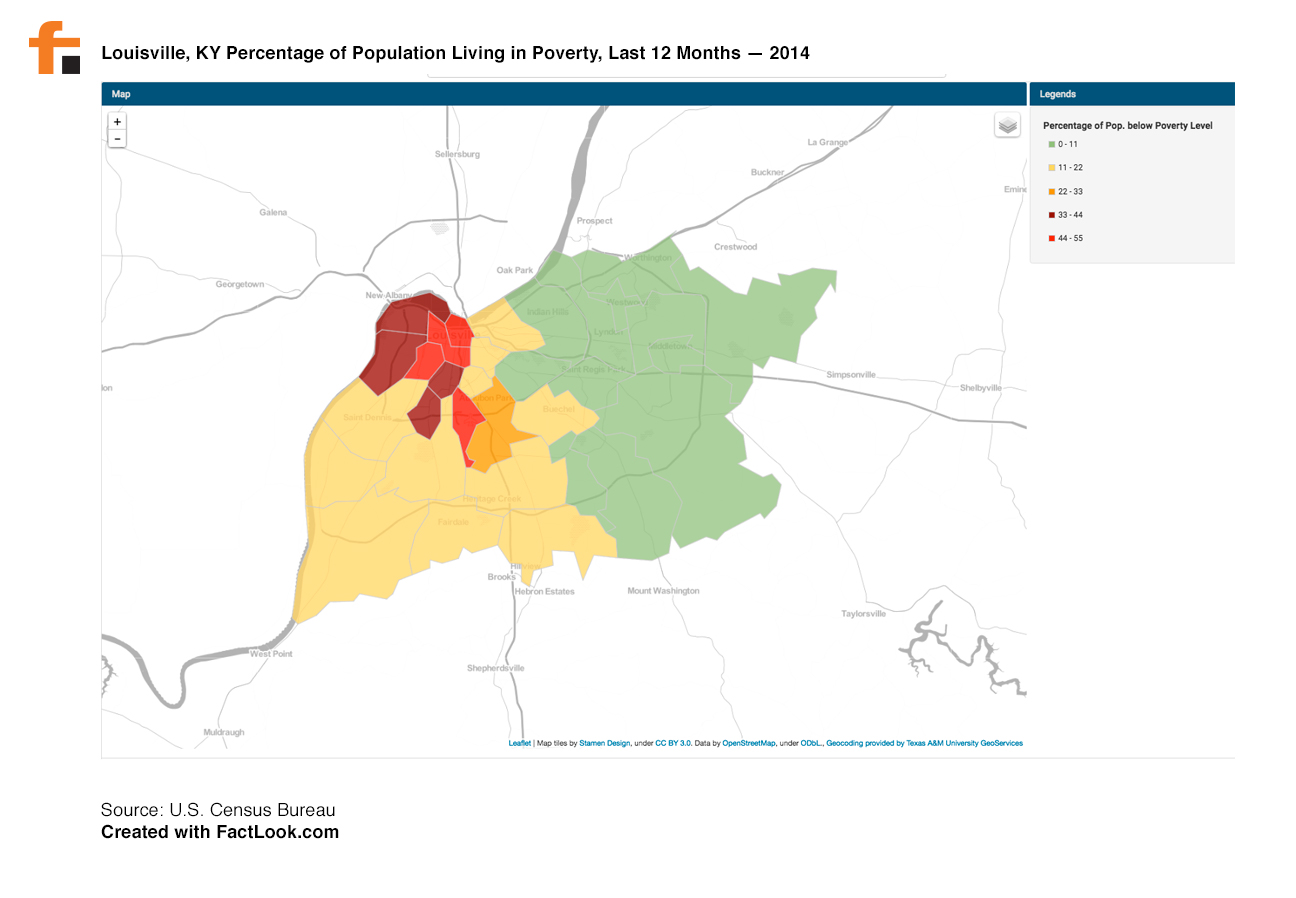
Finally, we used data from the 2014 Census to view the distribution of people who have lived below the poverty line during the past 12 months. The divide between eastern and western Louisville was pronounced.